👋
Blog Post
SEO Metrics That Matter in 2026
Learn the SEO metrics that matter – organic traffic, CTR, rankings, conversions, Core Web Vitals, bounce rate, AI visibility and how to track them using GA4, Search Console, Looker Studio, BigQuery ML, Semrush, Ahrefs, and AI analytics tools
Share

SEO Metrics That Matter in 2026
SEO success is no longer measured by rankings alone. In 2026, a strong SEO measurement system tracks visibility, traffic quality, user engagement, technical performance, conversions, revenue, and AI search visibility.
The most reliable SEO scorecard combines:
| SEO success layer | Core metrics | Best tools |
|---|---|---|
Search visibility |
Impressions, clicks, CTR, average position, query growth |
Google Search Console, Semrush, Ahrefs |
Traffic quality |
Organic users, organic sessions, landing page performance, AI referral traffic |
GA4, Looker Studio, Similarweb |
Engagement |
Engagement rate, bounce rate, scrolls, time, content interactions |
GA4, Microsoft Clarity, Hotjar |
Conversions |
Key events, leads, purchases, revenue, assisted conversions |
GA4, CRM, Google Ads, HubSpot |
Technical health |
Crawlability, indexability, Core Web Vitals, page speed, errors |
Search Console, PageSpeed Insights, Screaming Frog |
AI search visibility |
AI citations, brand mentions, AI referral sessions, prompt visibility |
Semrush AI tools, Ahrefs, HubSpot AEO, manual prompt tracking |
Google’s own guidance makes one principle clear: Search Console shows what happens before users land on your website, while GA4 shows what users do after they arrive. Used together, they give a more complete SEO performance picture.
Why SEO Measurement Has Changed
For years, SEO reporting often meant showing keyword rankings, organic traffic, and backlinks. Those metrics still matter, but they are no longer enough.
Modern SEO success depends on answering five business questions:
- Are we becoming more discoverable?
Measure impressions, query growth, rankings, AI citations, and non-branded visibility. - Are the right people visiting?
Measure organic sessions, landing page quality, engaged sessions, and segment by intent. - Are visitors satisfied?
Measure engagement rate, bounce rate, scrolls, internal clicks, return visits, and Core Web Vitals. - Is SEO creating business value?
Measure leads, purchases, pipeline, revenue, customer acquisition cost, and ROI. - Are we visible in AI-powered discovery?
Measure traffic from ChatGPT, Perplexity, Gemini, Copilot, Google AI Overviews, Google AI Mode, and brand mentions inside answer engines.
Organic search remains a major digital channel. BrightEdge research describes organic search as the largest trackable traffic channel and reports organic channel share at 53.3%. At the same time, Ahrefs found that 96.55% of pages receive no organic traffic from Google, which shows why measurement must go beyond publishing content and hoping it works.
AI discovery is also becoming measurable. Similarweb reported that generative AI platforms generated over 1.1 billion referral visits in June 2025, up 357% year over year, while AI referrals to transactional sites converted at about 7%.
The SEO Metrics Framework: From Visibility to Revenue
Think of SEO measurement as a funnel.
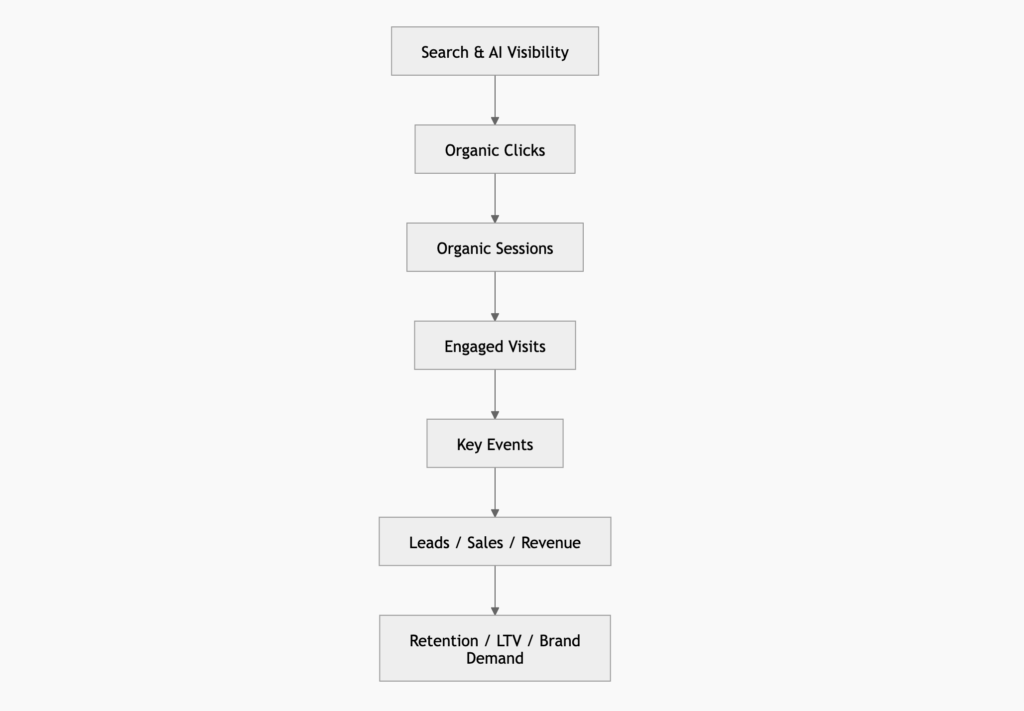
| Funnel stage | Metric examples | What it tells you |
|---|---|---|
Visibility |
Impressions, average position, AI citations, share of voice |
Whether your brand is being seen |
Clickability |
CTR, SERP feature presence, title performance |
Whether your search appearance earns clicks |
Traffic |
Organic sessions, users, landing page visits |
Whether SEO brings people to the site |
Engagement |
Engagement rate, bounce rate, scroll depth, page depth |
Whether visitors find the page useful |
Conversion |
Key events, lead forms, purchases, calls, demos |
Whether SEO supports business goals |
Revenue |
Revenue, pipeline, LTV, ROI |
Whether SEO is profitable |
The mistake many SEO teams make is reporting only the middle of the funnel: “organic traffic is up.” That is not enough. Traffic without conversions may be irrelevant. Conversions without visibility growth may be fragile. Rankings without clicks may be useless. Clicks without engagement may indicate a search intent mismatch.
Organic Traffic: The Most Common SEO Metric
What organic traffic measures
Organic traffic is the number of users or sessions that arrive through unpaid search results. In GA4, you usually analyze this through Traffic acquisition and filter by Organic Search or by source/medium such as google / organic.
Google’s GA4 Traffic acquisition report is designed to show where website and app visitors come from, including both new and returning users.
Track these organic traffic metrics
| Metric | Why it matters |
|---|---|
Organic sessions |
Shows total visit volume from organic search |
Organic users |
Shows how many people came from organic search |
New users from organic |
Measures SEO’s role in audience growth |
Organic landing page sessions |
Shows which pages attract search traffic |
Organic traffic by device |
Reveals mobile/desktop performance gaps |
Organic traffic by country/city |
Useful for local and international SEO |
Organic traffic by content type |
Helps compare blogs, service pages, product pages, and tools |
Organic traffic from AI tools |
Tracks referrals from ChatGPT, Perplexity, Gemini, Copilot, and similar platforms |
How to measure organic traffic in GA4
Go to:
Reports → Acquisition → Traffic acquisition
Then analyze:
- Session default channel group
- Session source / medium
- Landing page + query string
- Device category
- Country
- Key events
- Revenue
AI-powered tracking workflow
Use AI analytics tools to detect patterns you would normally miss:
| AI task | Example prompt |
|---|---|
Find traffic anomalies |
“Compare organic sessions for the last 28 days vs previous 28 days. Show landing pages with the biggest statistically meaningful decline.” |
Segment traffic quality |
“Group organic landing pages by intent: informational, commercial, local, transactional.” |
Detect content decay |
“Find pages where organic clicks declined for three consecutive weeks while impressions stayed stable.” |
Explain traffic drops |
“Check whether the drop is caused by fewer impressions, lower CTR, lower rankings, or tracking changes.” |
GA4 now includes generated insights that summarize trends and significant changes in plain language, which makes it easier to spot performance shifts quickly.
Search Impressions: The Early Warning Metric
What impressions measure
Search impressions show how often your website appeared in Google Search results. Impressions are one of the earliest signals of SEO growth because visibility often rises before clicks and conversions.
Search Console performance reports include metrics such as impressions, clicks, CTR, and position.
Why impressions matter
A page can lose traffic even when impressions rise. That usually means one of three things:
- Your rankings dropped.
- Your result became less clickable.
- The SERP changed because of ads, AI Overviews, featured snippets, local packs, shopping results, or other features.
A page can also gain impressions before it gains clicks. That often means Google is testing the page for more queries.
What to track
| Impression metric | How to use it |
|---|---|
Total impressions |
Measures overall search visibility |
Non-branded impressions |
Measures real SEO growth beyond brand demand |
Branded impressions |
Measures brand demand and reputation |
Query-level impressions |
Shows emerging keyword opportunities |
Page-level impressions |
Shows which pages Google is testing |
Country/device impressions |
Reveals geographic and mobile opportunities |
Branded vs Non-Branded SEO Growth
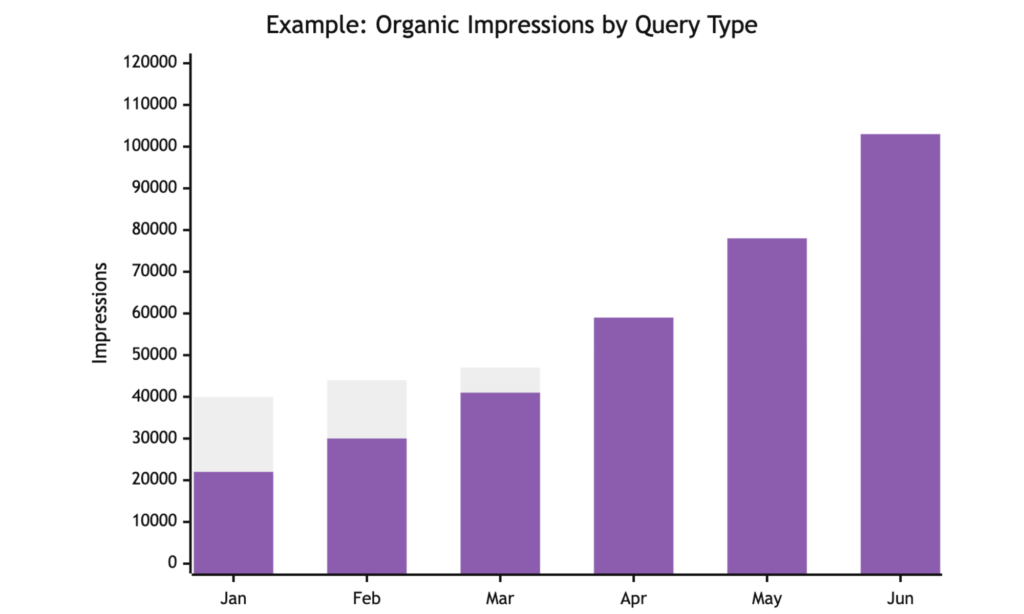
If non-branded impressions grow faster than branded impressions, your SEO is expanding demand capture. If only branded impressions grow, your SEO may be benefiting from brand marketing rather than creating new search visibility.
Clicks and CTR: Measure Search Result Appeal
What clicks measure
Clicks show how many users clicked your result from Google Search.
What CTR measures
CTR = Clicks ÷ Impressions × 100
CTR tells you whether your title, description, URL, brand, schema, and search result format are compelling enough to win the click.
Why CTR is tricky in 2026
CTR is affected by:
- Ranking position
- SERP layout
- AI Overviews
- Ads
- Featured snippets
- Local packs
- Video results
- Rich results
- Brand trust
- Search intent
- Device type
Google’s Search Console documentation says links in AI Overviews can count clicks and impressions, and AI Overview links are assigned the same position as the AI Overview block when reported. Google also states that AI features such as AI Overviews and AI Mode are included in Search Console’s overall Search traffic reporting under the Web search type.
CTR diagnosis table
| Pattern | Likely issue | Action |
|---|---|---|
Impressions up, clicks flat |
Weak CTR or SERP crowding |
Rewrite titles/meta descriptions, add schema, improve intent match |
Position stable, CTR down |
SERP changed or AI answer reduced clicks |
Track SERP features, improve brand/entity trust, optimize for richer snippets |
CTR high, engagement poor |
Title overpromises |
Align page content with search intent |
CTR low, position high |
Weak title or unclear value proposition |
Test benefit-led title tags |
CTR low, position low |
Ranking issue |
Improve content, internal links, backlinks, topical depth |
AI prompt for CTR improvement
Use this prompt:
“Analyze the top 20 organic landing pages with high impressions and below-average CTR. Group them by query intent. Suggest title tag rewrites that preserve the primary keyword, add a benefit, and stay under 60 characters.”
Keyword Rankings: Useful, But Not Enough
Keyword rankings still matter, but they are incomplete. A ranking report does not always explain traffic, revenue, or visibility inside AI-powered search experiences.
Track rankings in four layers
| Ranking layer | What to measure |
|---|---|
Primary keyword rank |
Your position for the main target keyword |
Keyword cluster rank |
Visibility across related queries |
SERP feature ownership |
Featured snippets, local pack, image/video results, rich results |
AI answer presence |
Whether your page or brand is cited in AI-generated answers |
Better ranking metrics
Instead of only reporting “average position,” track:
- Number of keywords in top 3
- Number of keywords in top 10
- Number of keywords in top 20
- Ranking distribution by intent
- Ranking distribution by content type
- Ranking changes for money pages
- Ranking changes for non-branded queries
- SERP features won/lost
- AI citations by topic
Ranking Distribution
| Ranking bucket | Last month | This month | Change |
|---|---|---|---|
Positions 1 to 3 |
24 |
31 |
Up 7 |
Positions 4 to 10 |
81 |
96 |
Up 15 |
Positions 11 to 20 |
142 |
128 |
Down 14 |
Positions 21 to 50 |
310 |
290 |
Down 20 |
Positions 51+ |
520 |
488 |
Down 32 |
This is more useful than one average ranking number because it shows whether keywords are moving into traffic-producing zones.
Engagement Rate and Bounce Rate
What engagement rate means in GA4
GA4 defines an engaged session as a session that lasts longer than 10 seconds, has a key event, or has at least two pageviews or screen views. Engagement rate is the percentage of engaged sessions. Bounce rate is the inverse: the percentage of sessions that were not engaged.
Why bounce rate is often misunderstood
A high bounce rate is not always bad.
For example:
- A blog post answering a simple question may have a high bounce rate but still satisfy the user.
- A contact page may have a high bounce rate because users call your business directly.
- A recipe page may have long dwell time but only one pageview.
- A local service page may convert through click-to-call without additional navigation.
In GA4, you should evaluate bounce rate together with engagement rate, key events, scroll depth, and conversion actions.
Engagement metrics to track
| Metric | What it reveals |
|---|---|
Engagement rate |
Whether sessions include meaningful activity |
Bounce rate |
Whether sessions fail GA4 engagement criteria |
Average engagement time |
How long users actively engage |
Scroll depth |
Whether users consume the page |
Internal link clicks |
Whether users continue the journey |
Video plays |
Whether embedded media is useful |
File downloads |
Whether content assets drive interest |
Form starts |
Whether visitors show intent |
Form completions |
Whether page traffic converts |
Diagnostic table
| Organic traffic pattern | Likely meaning |
|---|---|
High traffic + high engagement + low conversions |
Good content, weak CTA or offer |
High traffic + low engagement + low conversions |
Intent mismatch or poor page quality |
Low traffic + high engagement |
Good page that needs more visibility |
High traffic + high bounce + high conversions |
Not a problem if users complete the intended action |
High traffic + high bounce + no conversions |
Rewrite page to better match intent |
Conversions and Key Events: The Real SEO Scoreboard
Traffic is not the final goal. SEO should drive business outcomes.
In GA4, important actions are tracked as key events. Google explains that Analytics reports and explorations can count key events and attribute credit across touchpoints.
SEO conversion examples
| Business type | SEO key events |
|---|---|
SEO agency |
Consultation request, audit request, call click, pricing page visit |
SaaS |
Trial signup, demo booked, product-qualified lead |
Ecommerce |
Product view, add to cart, checkout, purchase |
Local business |
Call click, direction request, WhatsApp click, appointment booking |
Education |
Brochure download, course inquiry, webinar signup |
B2B services |
Case study view, contact form, sales meeting booked |
Essential SEO conversion metrics
| Metric | Formula |
|---|---|
Organic key events |
Count of key events from organic sessions |
Organic conversion rate |
Organic key events ÷ organic sessions × 100 |
Organic revenue |
Revenue attributed to organic traffic |
Assisted organic conversions |
Conversions where organic was part of the journey |
Lead-to-sale rate |
Sales from organic leads ÷ organic leads |
SEO ROI |
Organic profit or revenue value minus SEO cost ÷ SEO cost |
SEO ROI Tree
AI-powered conversion analysis
Use GA4, CRM exports, and AI analysis to answer:
- Which organic landing pages generate the highest-quality leads?
- Which blog posts assist conversions but do not convert directly?
- Which search intents produce pipeline?
- Which pages attract traffic but no business value?
- Which keywords influence sales calls?
- Which content clusters generate the best lead-to-sale rate?
GA4 predictive metrics can also be used in eligible properties for purchase probability, churn probability, and predicted revenue. Google notes that eligibility requires enough positive and negative examples, including at least 1,000 returning users meeting the predictive condition and at least 1,000 who do not, over the specified period.
Page Load Speed and Core Web Vitals
Why speed is an SEO metric
Page speed affects user experience, engagement, conversion rate, and search performance. Google’s Core Web Vitals measure real-world user experience for loading performance, interactivity, and visual stability.
Core Web Vitals thresholds
| Metric | Measures | Good threshold |
|---|---|---|
LCP |
Loading performance |
2.5 seconds or faster |
INP |
Responsiveness |
Less than 200 ms |
CLS |
Visual stability |
Less than 0.1 |
Google’s Search Central documentation recommends LCP within 2.5 seconds, INP under 200 milliseconds, and CLS under 0.1 for good user experience.
Important 2026 note: INP replaced FID
INP became a stable Core Web Vital in 2024, replacing FID. Google’s web.dev guidance explains that stable Core Web Vitals can evolve, and FID was retired as INP became stable.
PageSpeed Insights: field data vs lab data
PageSpeed Insights provides both lab and field data. Google says lab data is useful for debugging in a controlled environment, while field data captures real-world user experience, though with a more limited metric set.
Speed metrics to track
| Metric | Tool | Why it matters |
|---|---|---|
LCP |
PageSpeed Insights, Search Console, CrUX |
Main content loading speed |
INP |
PageSpeed Insights, Search Console, CrUX |
Real user responsiveness |
CLS |
PageSpeed Insights, Search Console, CrUX |
Layout stability |
TTFB |
PageSpeed Insights, server logs |
Server response speed |
Lighthouse score |
Lighthouse, PageSpeed Insights |
Lab-based performance benchmark |
Mobile vs desktop performance |
PageSpeed Insights, CrUX |
Helps prioritize device-specific fixes |
Template-level performance |
Screaming Frog + PSI API |
Finds slow page types at scale |
Core Web Vitals Scorecard
| Page type | LCP | INP | CLS | Status |
|---|---|---|---|---|
Homepage |
2.1s |
160ms |
0.04 |
Good |
Blog posts |
3.4s |
210ms |
0.08 |
Needs LCP/INP work |
Service pages |
2.8s |
180ms |
0.13 |
Needs LCP/CLS work |
Product pages |
4.2s |
290ms |
0.20 |
Poor |
AI-powered speed workflow
Use AI to group problems by template, not just URL:
“Analyze this PageSpeed export and group URLs by shared performance issue: slow server response, render-blocking JavaScript, unoptimized images, layout shift, third-party scripts, or unused CSS. Prioritize fixes by traffic and conversion value.”
Crawlability, Indexability, and Technical SEO Metrics
SEO measurement must include whether search engines can access, crawl, index, and understand your pages.
Google’s SEO Starter Guide explains that SEO best practices help search engines crawl, index, and understand your content.
Technical SEO metrics to track
| Metric | Why it matters |
|---|---|
Indexed pages |
Shows how much of your site is eligible for search |
Crawled pages |
Shows whether Googlebot is discovering your URLs |
Not indexed pages |
Reveals canonical, duplicate, quality, or crawl issues |
404 errors |
Wastes crawl paths and hurts UX |
5xx errors |
Indicates server instability |
Redirect chains |
Slows crawling and weakens UX |
Canonical mismatches |
Can cause wrong URLs to rank |
Duplicate titles/meta |
Weakens search relevance |
Orphan pages |
Important pages may lack internal link equity |
XML sitemap coverage |
Helps validate discoverability |
Robots.txt blocks |
Can accidentally block key pages |
Noindex pages |
Must be intentional |
Tools
- Google Search Console indexing reports
- Screaming Frog SEO Spider
- Sitebulb
- Ahrefs Site Audit
- Semrush Site Audit
- Server logs
- BigQuery for large-scale crawl logs
Screaming Frog supports AI integrations with OpenAI, Gemini, Ollama, and Anthropic while crawling, plus crawl comparison and Looker Studio crawl reports.
AI crawl audit prompt
“Review this crawl export and identify high-priority technical SEO issues affecting indexable commercial pages. Separate issues into crawlability, indexability, metadata, internal linking, schema, speed, and content duplication.”
Backlink and Authority Metrics
Backlinks remain important, but not all links are equal.
Track these authority metrics
| Metric | What it shows |
|---|---|
Referring domains |
Number of unique websites linking to you |
Link quality |
Relevance and authority of linking sites |
Link velocity |
How quickly you earn or lose links |
Lost backlinks |
Links that disappeared |
Toxic/spam links |
Potential risk signals |
Anchor text distribution |
Whether link text is natural |
Links to money pages |
Whether commercial pages receive authority |
Digital PR mentions |
Brand authority even without links |
Competitor link gap |
Link opportunities competitors have |
Better backlink reporting
Avoid reporting only “we built 20 backlinks.” Instead, report:
- How many links went to revenue-generating pages?
- Did rankings improve after links were earned?
- Did referral traffic or branded search increase?
- Did links come from relevant, trusted websites?
- Did the page’s organic visibility improve?
AI-powered link analysis
“Compare our referring domains with three competitors. Identify high-authority, niche-relevant domains linking to at least two competitors but not us. Prioritize by topical relevance and likelihood of outreach success.”
We created a checklist that helps you dominate Google and LLMs in 2026. The checklist has practical SEO tips that the top SEOs use daily. Get it for FREE.
Content Performance Metrics
Content SEO measurement should answer whether content is discoverable, useful, trusted, and profitable.
Content metrics to track
| Metric | What it tells you |
|---|---|
Organic clicks by article |
Which content attracts search traffic |
Impressions by topic cluster |
Which themes Google associates with your site |
Engagement rate by article |
Whether readers find the content useful |
Assisted conversions |
Which informational content influences sales |
Internal link clicks |
Whether content moves users deeper |
Scroll depth |
Whether users consume the article |
Content decay |
Whether older content is losing traffic |
Query expansion |
Whether a page ranks for more related searches over time |
AI citations |
Whether AI answer engines cite or mention the content |
Content decay formula
Content decay = Current 28-day clicks vs previous 28-day clicks
Segment decay into:
- Seasonal decline
- Ranking decline
- CTR decline
- Impression decline
- SERP feature disruption
- Content freshness issue
- Competitor improvement
- Search intent change
Content Refresh Priority Matrix
| Page type | Traffic loss | Conversion value | Refresh priority |
|---|---|---|---|
Service page |
Medium |
High |
Very high |
Product comparison |
High |
High |
Very high |
Old blog post |
High |
Low |
Medium |
News article |
High |
Low |
Low |
Case study |
Low |
High |
Medium |
Glossary page |
Medium |
Medium |
Medium |
AI content analytics workflow
- Export Search Console queries by page.
- Export GA4 engagement and conversion data by landing page.
- Use AI to classify each page by search intent.
- Identify pages with high impressions but low CTR.
- Identify pages with high traffic but low engagement.
- Identify pages with high engagement but low conversions.
- Identify pages that should be merged, updated, expanded, or pruned.
Ahrefs’ AI Content Helper grades content against top-ranking pages to identify topical coverage gaps and improve relevance.
Local SEO Metrics
For local businesses, SEO success is not only website traffic. It also includes calls, directions, map visibility, reviews, and local conversions.
Local SEO metrics to track
| Metric | Why it matters |
|---|---|
Google Business Profile views |
Measures local visibility |
Calls |
Direct lead generation |
Direction requests |
Local purchase intent |
Website clicks |
Local-to-site traffic |
Local pack rankings |
Visibility in map results |
Reviews |
Trust and conversion influence |
Average rating |
Reputation signal |
Review velocity |
Fresh trust signal |
Photo views |
Local profile engagement |
Local landing page conversions |
Business value |
AI workflow for local SEO
“Analyze local landing page performance by city. Compare organic traffic, calls, form submissions, direction clicks, and ranking visibility. Identify which locations need content improvements, review growth, or technical fixes.”
AI Search Metrics: Measuring SEO in the Answer Engine Era
AI search changes how users discover brands. Some users click fewer links. Others arrive more informed and more likely to convert. Your SEO reporting must now include AI visibility and AI referral quality.
Google says the same SEO fundamentals apply to AI features such as AI Overviews and AI Mode, and there are no additional technical requirements beyond being indexed and eligible to show a snippet.
AI SEO metrics to track
| Metric | Definition |
|---|---|
AI referral sessions |
Sessions from ChatGPT, Perplexity, Gemini, Copilot, Claude, etc. |
AI referral conversion rate |
Key events or purchases from AI referral sessions |
AI citation rate |
Percentage of tested prompts where your site is cited |
AI brand mention rate |
Percentage of prompts where your brand is mentioned |
AI sentiment |
Whether AI responses describe your brand positively, neutrally, or negatively |
Competitor citation share |
How often competitors are cited instead of you |
Prompt coverage |
Your visibility across commercial, informational, and comparison prompts |
AI-assisted revenue |
Revenue influenced by AI referrals or AI-discovered visitors |
AI visibility measurement template
| Prompt | Platform | Are we cited? | Competitor cited? | Sentiment | Landing page | Action |
|---|---|---|---|---|---|---|
“Best software training in Hyderabad” |
ChatGPT |
No |
Competitor A |
Neutral |
– |
Create comparison page |
“How to choose best course” |
Perplexity |
Yes |
Competitor B |
Positive |
Blog post |
Add case study |
“Best courses after btech” |
Gemini |
No |
Competitor C |
Neutral |
– |
Publish course comparison |
“Institute selection checklist” |
Google AI Overview |
Yes |
Competitor A |
Positive |
Guide |
Add schema and examples |
How to track AI referral traffic in GA4
Create a custom exploration or custom channel group using sources such as:
- chatgpt.com
- perplexity.ai
- gemini.google.com
- copilot.microsoft.com
- claude.ai
- poe.com
- you.com
- phind.com
- brave.com
Then report:
- AI referral sessions
- AI referral engagement rate
- AI referral key events
- AI referral revenue
- AI referral landing pages
Important caution
AI visibility is volatile. Do not treat a single prompt test as a definitive ranking report. Run the same prompt set weekly or monthly, test multiple platforms, and track directional trends.
Explore Our Conversion-Focused AI SEO Services
AI-Powered Analytics Tools for SEO Measurement
1. Google Search Console
Best for:
- Impressions
- Clicks
- CTR
- Average position
- Query data
- Page performance
- Indexing
- Core Web Vitals
- AI Overview and AI Mode reporting inside Web search totals
Google has also introduced AI-powered configuration in Search Console, allowing users to describe the analysis they want in natural language and have the report filters/settings configured automatically.
2. Google Analytics 4
Best for:
- Organic traffic
- Engagement rate
- Bounce rate
- Key events
- Revenue
- Traffic acquisition
- User behavior
- Predictive audiences
GA4 generated insights summarize trends and significant changes in plain language.
3. Looker Studio
Best for:
- SEO dashboards
- Blending GA4 and Search Console
- Executive reporting
- Client reporting
- Page-level performance views
Google recommends using Looker Studio to visualize Search Console and Google Analytics data together.
4. BigQuery ML
Best for:
- Large-scale SEO data
- Anomaly detection
- Forecasting
- Joining GA4, Search Console, CRM, and crawl data
- Predictive SEO reporting
BigQuery ML supports time-series forecasting and anomaly detection using functions such as ML.DETECT_ANOMALIES.
5. Semrush
Best for:
- Keyword tracking
- Competitor visibility
- Technical audits
- Share of voice
- AI-powered SEO recommendations
- AI visibility tracking
Semrush describes Copilot as an AI-powered SEO assistant that analyzes project data to provide personalized recommendations, alerts, keyword opportunities, and competitor insights.
6. Ahrefs
Best for:
- Backlink analysis
- Keyword research
- Content gap analysis
- Organic traffic estimates
- Content optimization
- AI content improvement workflows
Ahrefs’ AI Content Helper is designed to identify topical coverage gaps by comparing content against top-ranking pages.
7. Screaming Frog SEO Spider
Best for:
- Technical SEO audits
- Metadata audits
- Internal link analysis
- Crawl comparison
- JavaScript rendering checks
- PageSpeed API integration
- AI-assisted crawl analysis
Screaming Frog supports AI prompts with OpenAI, Gemini, Anthropic, and Ollama while crawling.
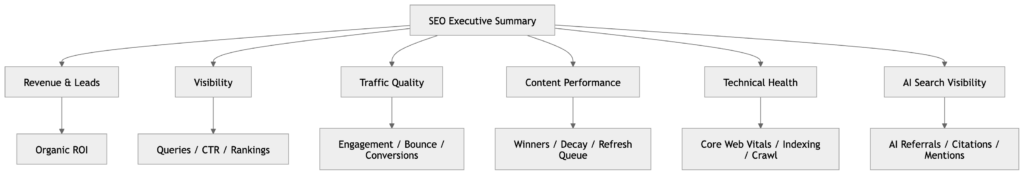
The Ideal SEO Dashboard
A strong SEO dashboard should not be a data dump. It should tell a story.
Executive SEO Dashboard
| Section | Metrics |
|---|---|
Business outcome |
Organic leads, organic revenue, pipeline, ROI |
Visibility |
Impressions, non-branded impressions, average position, AI citations |
Traffic |
Organic sessions, users, landing pages, AI referrals |
Engagement |
Engagement rate, bounce rate, average engagement time |
Conversion |
Key events, conversion rate, assisted conversions |
Technical health |
Indexed pages, Core Web Vitals, crawl errors, page speed |
Content |
Top pages, declining pages, new winners, refresh priorities |
Authority |
Referring domains, quality links, lost links |
Competitors |
Share of voice, ranking gap, content gap |
Dashboard wireframe
Weekly, Monthly, and Quarterly SEO Reporting
Weekly SEO checks
Track:
- Organic traffic anomalies
- Search Console clicks and impressions
- Top landing page drops
- Indexing errors
- Core Web Vitals warnings
- Technical crawl issues
- New high-impression queries
- AI referral traffic changes
Monthly SEO reporting
Track:
- Organic traffic by landing page
- Non-branded visibility growth
- Organic leads and revenue
- Ranking distribution
- CTR wins/losses
- Content decay opportunities
- Technical SEO progress
- Backlink growth/loss
- AI visibility benchmark
Quarterly SEO strategy review
Track:
- SEO ROI
- Pipeline from organic search
- Content cluster performance
- Market share/share of voice
- Competitor visibility changes
- Technical debt reduction
- Content refresh impact
- AI search presence
- Resource allocation for the next quarter
SEO Metrics by Business Type
SEO agency or service business
| Goal | Best metrics |
|---|---|
Generate leads |
Organic form fills, call clicks, booked calls |
Build authority |
Non-branded impressions, backlinks, branded search |
Improve service page performance |
Service page rankings, CTR, conversion rate |
Prove ROI |
Lead value, close rate, organic pipeline |
Ecommerce
| Goal | Best metrics |
|---|---|
Increase sales |
Organic revenue, purchases, product page traffic |
Improve product discovery |
Category impressions, product query rankings |
Reduce wasted traffic |
Add-to-cart rate, checkout rate, revenue per session |
Improve technical SEO |
Indexation, faceted navigation, Core Web Vitals |
SaaS
| Goal | Best metrics |
|---|---|
Generate trials/demos |
Demo requests, trial signups, product-qualified leads |
Build category demand |
Non-branded informational and commercial impressions |
Influence pipeline |
Assisted conversions, CRM-sourced organic leads |
Improve retention |
Organic users who become active users |
Local business
| Goal | Best metrics |
|---|---|
Drive calls |
Call clicks, GBP calls, mobile organic conversions |
Drive visits |
Direction requests, local landing page traffic |
Build trust |
Reviews, average rating, review velocity |
Win local visibility |
Local pack rankings, city landing page visibility |
Common SEO Reporting Mistakes
Mistake 1: Reporting rankings without business impact
A keyword ranking #1 is not valuable if it does not bring qualified traffic or conversions.
Mistake 2: Reporting traffic without intent
Traffic from irrelevant informational queries can inflate reports while generating no revenue.
Mistake 3: Ignoring non-branded search
Branded traffic often reflects existing demand. Non-branded traffic shows whether SEO is expanding reach.
Mistake 4: Treating bounce rate as automatically bad
GA4 bounce rate is the inverse of engagement rate, and an engaged session depends on time, pageviews, or key events. A user can bounce and still find what they need.
Mistake 5: Comparing Search Console clicks directly to GA4 sessions
Google warns that Search Console clicks and GA4 sessions are calculated differently, so the numbers will not match exactly.
Mistake 6: Ignoring AI search traffic
AI referrals may still be smaller than Google organic traffic, but they are growing quickly and can convert well in certain industries. Similarweb’s 2025 report found AI platforms generated over 1.1 billion referral visits in June 2025.
Mistake 7: Not separating page types
A blog post, service page, product page, and location page should not be judged by the same metric.
The SEO Success Scorecard
Use this scorecard to evaluate your SEO program.
| Category | Poor | Healthy | Excellent |
|---|---|---|---|
Visibility |
Impressions flat or declining |
Branded and non-branded impressions growing |
Non-branded visibility growing across clusters |
CTR |
Declining across key pages |
Stable by position and intent |
Improving from title/schema testing |
Traffic |
Organic traffic volatile |
Organic traffic growing steadily |
Qualified organic traffic growing by intent |
Engagement |
Low engagement, high exits |
Engagement improving by page type |
Strong engagement and internal journeys |
Conversions |
Traffic does not convert |
Key events growing |
Revenue/pipeline growing predictably |
Technical health |
Indexing and speed issues |
Issues monitored and fixed |
Technical debt reduced proactively |
Content |
Random publishing |
Content mapped to keyword clusters |
Content tied to revenue and AI visibility |
Authority |
Few relevant links |
Steady link acquisition |
Strong topical authority and digital PR |
AI visibility |
Not tracked |
AI referrals and citations monitored |
AI prompts, citations, and conversions optimized |
30-60-90 Day SEO Measurement Plan
First 30 days: Build the foundation
- Connect GA4 and Search Console.
- Define key events.
- Create organic traffic segments.
- Set up Search Console query/page tracking.
- Build a Looker Studio dashboard.
- Run a full crawl.
- Benchmark Core Web Vitals.
- Set up AI referral filters in GA4.
- Create a baseline keyword and content performance report.
Days 31–60: Diagnose and prioritize
- Identify high-impression, low-CTR pages.
- Identify high-traffic, low-conversion pages.
- Find pages with content decay.
- Segment branded vs non-branded search.
- Prioritize Core Web Vitals fixes by traffic and revenue.
- Map keyword clusters to landing pages.
- Run competitor content and backlink gap analysis.
- Start AI citation tracking for core commercial prompts.
Days 61–90: Optimize and prove impact
- Refresh decaying content.
- Rewrite low-CTR title tags.
- Improve internal linking to money pages.
- Fix crawl/indexing issues.
- Optimize slow templates.
- Add or improve schema markup.
- Build topic clusters around commercial intent.
- Report SEO impact in leads, pipeline, revenue, and ROI.
Copy-Ready SEO Metrics Infographic
The 7 Metrics That Prove SEO Is Working
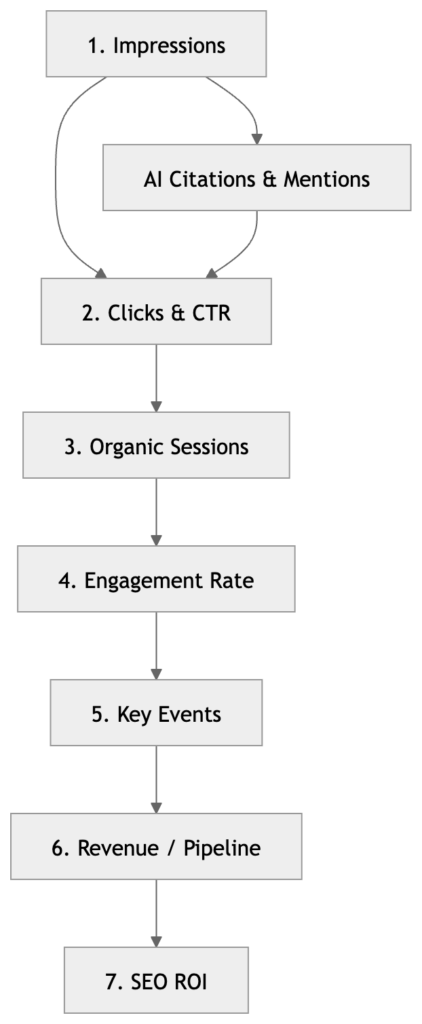
Conclusion: Measure SEO Like a Growth System, Not a Ranking Report
SEO success is not just ranking higher. It is the ability to create measurable business growth from organic discovery.
A modern SEO measurement system should show:
- How visible your brand is
- Which queries and pages drive discovery
- Whether users click your results
- Whether organic visitors engage
- Whether SEO traffic converts
- Whether SEO generates revenue
- Whether technical issues block growth
- Whether your brand appears in AI-powered discovery experiences
The best SEO teams do not report metrics in isolation. They connect Search Console, GA4, Looker Studio, BigQuery, AI analytics tools, rank trackers, crawlers, CRMs, and AI visibility platforms into one decision-making system.
The future of SEO reporting belongs to teams that can answer one question clearly:
“Which SEO actions created measurable business growth—and what should we do next?”